Data Science, Diverse, Success-Stories
Webcrawling Dashboard
Interactive dashboard for analysis of crawling results
vonThomas Maier
16 Apr 24
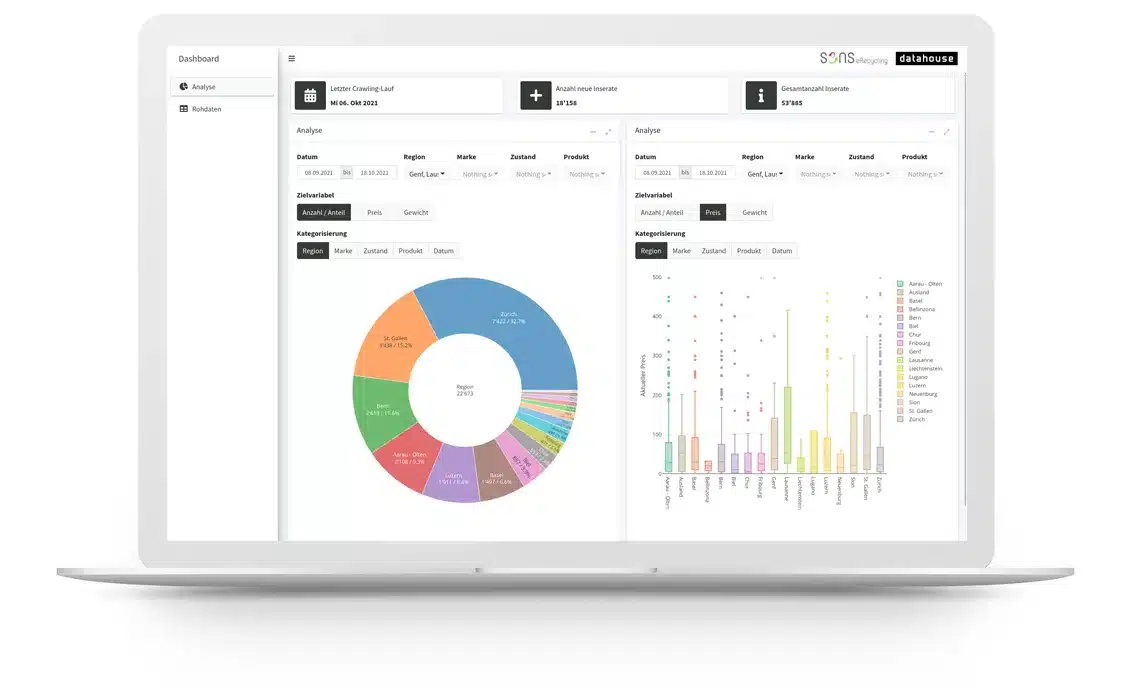
SENS wants to track the reuse of electrical appliances in Switzerland in order to implement potential measures and decisions based on data. Just a few weeks after the kick-off, SENS was able to examine the first data sets on a customized analysis dashboard.

Customer need
SENS promotes the sustainable recycling of electrical and electronic equipment. In addition to recycling, the reuse of equipment is also of interest to SENS. In order to promote circular economy measures in a targeted manner and thus conserve valuable resources, our customer requires information on products as well as on regional and seasonal volume trends on the secondary market. SENS would therefore like to identify and analyze information on the reuse of electrical and electronic equipment.
Project procedure
For this project, we chose an iterative approach in order to be able to react as flexibly as possible to new findings. We developed the corresponding functionality in relatively short iterations, which was then presented and discussed at a review meeting. Based on the insights gained, the planning for the next iteration was created in each case.
At the kickoff meeting, we reviewed possible data sources with SENS. Based on their needs and technical feasibility, we selected a suitable trading platform as the primary source. In a first iteration, we developed the webcrawler within two weeks to retrieve the relevant data regularly and store it processed in a suitable database. In the subsequent review meeting, we discussed the data quality and data preparation with SENS. We also outlined various options for the dashboard based on the analysis needs.
SENS plans to conduct exploratory data analyses. For this, we chose a flexible and interactive approach for the dashboard so that emerging issues could be easily explored. During the next iteration, we developed the dashboard within three weeks in an ongoing exchange with SENS, who already received test access to follow the development. In the subsequent review meeting, we discussed and prioritized final optimization approaches. In a final development iteration, the web crawler and the dashboard were finalized within a few weeks.
„Datahouse perfectly met my needs, kept me informed about the development status and always took my wishes seriously.“
Pasqual Zopp, Stv. Geschäftsführer, Manager Back Office
End produkt
SENS has exclusive access to a customized analysis dashboard. On this, SENS can analyze all collected data and export it as desired. Datahouse ensures the operation of the dashboard and the web crawler in the background and continuously monitors the data quality from the automated regular queries.
Technologies used
The dashboard was developed using the R Shiny framework. For webcrawling we used Python Scrapy and our proven special infrastructure for coordination and monitoring. All data is stored in a MongoDB database.
More
Are you facing similar challenges or do you have a similar project that you need help with? Then don’t hesitate to contact our Senior Expert Data Scientist Thomas Maier.